 This image can be found at: hosting.soonet.ca/.../bl130lec7.html
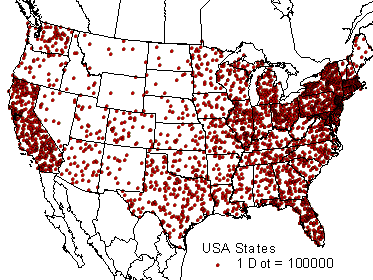
The Dot Distribution Map uses dots to represent a value such as population. In this map of the United States, each dot represents 100,000 people.
 This image can be found at: hosting.soonet.ca/.../bl130lec7.html
No comments:
Post a Comment